Counterbalance Economics (CBE) Modelling
Computer simulations allow researchers to model real-world and hypothetical situations and test outcomes. We have used an existing computer application called Netlogo, which has been around for over 25 years. The Wealth Distribution and Bidding Market models are examples of Agent Based Modelling (ABM) tools and used for many years to answer various questions about how populations behave from an economic perspective and to test what if scenarios.
Now that you know a bit about Counterbalance Economics (CBE), the next step is to model it using the Netlog ABM tool to allow validation, verification and replication (Wilensky & Rand, 2015, pp. 250-251).
We have made the amended ABM tool and economics data available to anyone with a computer (or smartphone) to allow individuals and researchers to validate, verify and replicate the results published here. The initial download and setup will take approximately 5 min.
What is an Agent Based Model? The creator of Netlogo, Professor Uri Wilensky and Professor William Rand co-authored a book on Agent Based Modelling (Wilensky & Rand, 2015, pp. 250-251). Hear an overview of ABM on the YouTube links:
Step 2. Download Wealth Distribution Model
Click the image below to download the file, save it somewhere safe, so you can open it from the Netlogo application (File menu)

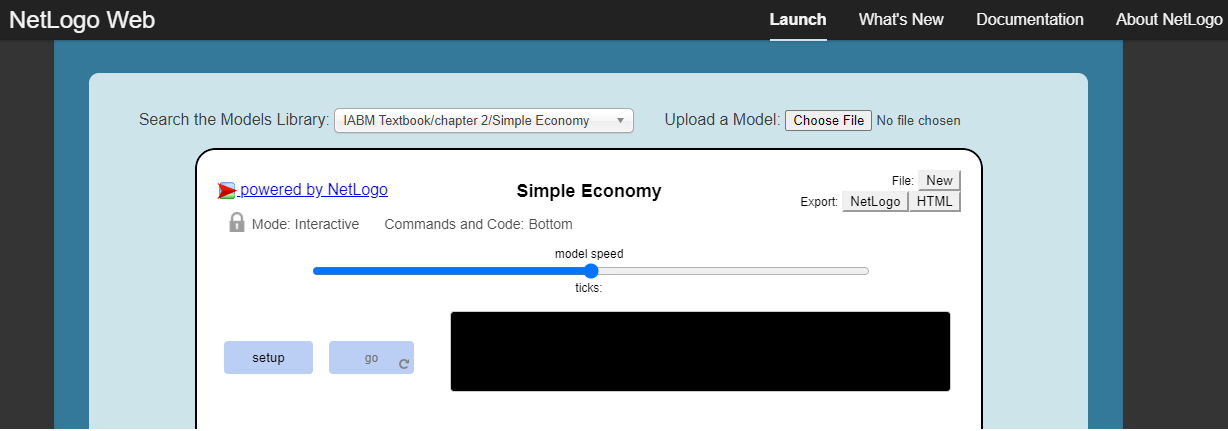
Step 1. Open Web-based Netlogo application. Click on the image below to begin:
Please note that Netlogo program works better when downloaded onto PC or MAC
Step 3. Click image to open Wealth Distribution Model Info page (PDF)
PDF details how to run the model. Press Setup and Go buttons! Watch what happens when the simulator is run in the
Neoliberal-v-GovernmentRun setting, then compare it to the Counterbalance!

The Wealth Distribution Model simulates community and individual wealth as well as income inequality. First off, run the model in Neoliberal-v-GovernmentRun setting. Then run the Counterbalance setting to see what would happen if the CBE was added to the Australian, US, UK, Swiss or German economies.
Step 4. Download Bidding Market Model - Save it. Open Netlogo, choose the File button to find the file & open it.

The Bidding Market Model simulates the level of unemployment, and what would happen if we provided a job for everyone who wanted one. Compare Australia's economic system and then watch what happens once the CBE is implemented.
Step 5. Click image to Open/Save the Bidding Market Info (PDF). PDF details how to run the model.

The CBE Wealth Distribution model allows us to theoretically simulate any global economy and by changing the chooser, also compare the results obtained with the results that would have been obtained had the CBE model been implemented/added to that economy. The ABM was used to simulate the economies of Australia, US, UK, Switzerland and Germany and was run 325,000 times to obtain the 65 observations contained in the regression analysis tables, below. We expected that adding the CBE to a given economy would significantly reduce income inequality. Based on our interpretation of the STATA regression table below, the null hypothesis can be rejected given that p < 0.011 and F is larger than critical F. 119.22 >2.371.
We expected that adding the CBE to a given economy would increase the wealth available as measured by the GDP. Again, based on our interpretation of the STATA regression table (below), the null hypothesis can be rejected given that
p < 0.001 and F is larger than critical F. 2025.95 > 3.145
The Bidding Market model has been adapted to test the inflationary pressures that would occur if we tried to reduce unemployment to zero and then compared that to what would happen if the CBE model had been added. Below is a graph showing the results.

The Bidding Market model simulates employing everyone who wanted a job, which produces inflationary pressure in the standard economic systems.
Compare this to the massive reduction of inflationary pressure after the CBE model is added to that economy. It is not designed to predict what level of inflation would occur, but rather test if implementing the CBE would reduce the inflationary pressure.
The STATA Results
Simple instructions on how to download and test the models yourself
References
Malliaros, P. (2021). Are Countertrade credits as flexible and efficient as cash? A novel approach to reducing income inequality using countertrade methodology.(Version 1.0.0). CoMSES Computational Model Library https://www.comses.net/codebases/fac2bacc-6728-44cc-b1f5-45bae24fcdd2/releases/1.0.0/
Wilensky, U. (1998). NetLogo Wealth Distribution model. http://ccl.northwestern.edu/netlogo/models/WealthDistribution. Center for
Connected Learning and Computer-Based Modeling, Northwestern University, Evanston, IL.
Wilensky, U. (1999). NetLogo. http://ccl.northwestern.edu/netlogo/. Center for Connected Learning and Computer-Based Modeling,
Northwestern University, Evanston, IL.
Wilensky, U., & Rand, W. (2015). Verification, Validation and Replication. In An introduction to agent-based modeling: Modeling natural,
social, and engineered complex systems with NetLogo. The MIT Press.

In the spreadsheet modelling we created a hypothetical society of 100 individuals and in this society, individual one earned $1, individual two earned $2 up to individual one hundred who earned $100. To calculate the AWE, you would normally add the earnings of every individual and divide that number by the number of individuals (1 + 2 + 3 … + 100 = 5050)/100 = $50.50 However, in year two if we paid the bottom 50 per cent of employees 50.50 in CC’s the AWE would increase to $63 (50.5 + 50.5 + 50.5 … 100 = 6300)/100 = $63 and so on until as discussed the AWE would equal the amount being paid to the top income earners. However, if we fix the amount being paid to the bottom 50 per cent in the first year and use that number to calculate the AWE each year from then on, it stops the AWE from rising unless the top 50 per cent of employees get a pay rise. This means that each year, the bottom 50 per cent of income earners would receive a pay rise in line with the increase in the AWE caused by pay rises to the top 50 per cent earners.
Initially, a spreadsheet model was created to test the AWE hypothesis which also allowed us to test various potential scenarios.
6.1 Scenario 1 (Column H)
Q. What would happen if the unemployment rate increased to 90 per cent?
A. The modelling shows us that if a portion of the top 50 per cent of employees became unemployed, they could immediately choose to be paid in CC’s and cushion the fall experienced by all especially if as discussed in the previous section, the minimum was fixed to that calculated in the first year.
6.2 Scenario 2 (Column K)
Q. What would happen if the top half doubled their income?
A. The modelling shows us that the bottom 50 per cent of income earners would enjoy a substantial increase in their income as well.
6.3 Scenario 3 (Column AL)
Q. What happens if the population tripled in size?
A. As the minimum for the bottom 50 per cent has been calculated, there is no need to recalculate that number. Just use the standard calculation to work out the new AWE each year (tick).
Example with 300 people in the model (Column AL)
• Countertrade Credit Earners 1275
• Rest of Population 43875
• Total 45150
• AWE 150.5
The outcome is that CC earners would once again enjoy an increase in their income as the AWE was raised due to the increased population and the increase in economic activity.
6.4 Scenario 4 (Column AN)
Q. What happens if the population halves in size? A. In this situation, the AWE may or may not go below the minimum AWE set in Year 0 (Column A). If it does go below the minimum, then it is recommended that the minimum continues to apply until income levels once again rise above the amount set in year 0.
Level of Unemployment based Inflation
Based on the simulation, introducing the CBE into the Australian, UK, US, Swiss or German economies would result in an overall GDP increase of 34% and the level of inequality would be reduced from an average of 0.33 down to an average of 0.088. Further research will be conducted which includes a pilot to test the robustness of the results achieved in the simulation.
Spreadsheet Scenario Modelling

